Wednesday 5 December 2012

Conclusion


Based on the data collected from questionnaires, I would like made an overall conclusion for KFC, Genting Kelang. In the previous post, I had showed the questions and the results that gathered from 20 respondents. There are 4 categories in customers’ satisfaction which are food, environment, services and staffs. There are divided to 5sub part in each of the category.

  Category
     Average
     mean (a)
        Average
        mean(b)
         Average
          mean ( c)
         Average
         mean (d)
            Average
            mean (e)
Food
2
3.2
3.45
3.7
3.75
Environment
2.95
2.95
3.35
3.45
3.3
Services
3.15
3
3.45
3.35
3.6
Staff
3.1
2.9
3.1
3.1
3.05

Based on the table above, it shows that for food category, sub part (e) attain the highest mean which is 3.75. The question is about the dishes were tasty and delicious, so average of the 20 respondents are agree with it. However, there are only 2.00 for sub (a), the food was healthy. Big part of the respondents feels that they are disagreeing with this question. 

Besides that, in the environment, KFC achieve the highest average mean for sub part (d) among the 5 sub part, which are 3.45. Yet, KFC need to improve the cleanliness for restaurant and washroom, it is only attains 2.95 respectively for sub (a) and (b), which is the lowest average mean in the environment. 

Furthermore, for the service category, the highest average mean is 3.6 for sub (e), the question is asking about the food order was correct and complete. A big of the respondents feels that KFC has done a good job for taking the food order correctly. However, there are only 3.00 for sub (b) which is the waiting time was short.  Respondents do not agree with it.

Moreover, in the staff category, the average mean are moderate, there have 3 same average mean for staff which is sub (a), (c) and (d). Respondents feel that the staffs in KFC do not have a good behaviour when serving the customers. The lower average mean is sub (b); the question is the staffs were aware for taking order with customers.  Staffs in KFC do not get attention on the customers. 

On the whole, KFC at Genting Kelang have a good customers satisfaction, it can clearly see that in 4 categories, there are big part of the sub part which get 3 points. But, KFC still can improve their services and staffs. KFC can let train their staffs and receive more feedback from customers. So that, KFC can gain more customers.
 

Sunday 2 December 2012

Analysis of data

This are the data collected through questionnaires method among 20 respondents in KFC, Genting Kelang.  There are table and histogram showing the data. For gender part, I will use bar chart and table to clearly show the data.
PartA
1. Gender

Male/Female

Frequency
Percent
Valid Percent
Cumulative Percent
Valid
Male
10
50.0
50.0
50.0
Female
10
50.0
50.0
100.0
Total
20
100.0
100.0

 
 The data collection shows that there are 50% of male and 50% of female among 20 respondents had done the questionnaire in KFC, Genting Kelang.
 

2. Age group

Age group

Frequency
Percent
Valid Percent
Cumulative Percent
Valid
18-20
10
50.0
50.0
50.0
21-23
8
40.0
40.0
90.0
27-29
2
10.0
10.0
100.0
Total
20
100.0
100.0


There are 50% of respondents are belong to 18-20 group age, 40% of respondents are in21-23 group age, and 10% of respondents are under27-29 group age. However, there and none of respondents are belong to 24-26 group age and group age for 30 and above from the data collected.


Part B
1.

How many times do you go KFC in a week?

Frequency
Percent
Valid Percent
Cumulative Percent
Valid
1
13
65.0
65.0
65.0
2
4
20.0
20.0
85.0
3
1
5.0
5.0
90.0
4
1
5.0
5.0
95.0
<5
1
5.0
5.0
100.0
Total
20
100.0
100.0


This is the customer satisfaction part. Based on the information collected, it can see that 65% of respondents are visiting KFC once in a week. 20% of respondents are patronizing KFC twice in a week. Then, there are only 5% of respondents are fall on the category of patronizing KFC 3, 4 and above 5 times a week in KFC.

 
2. Favourite meal            
a)

Colonel Burger

Frequency
Percent
Valid Percent
Cumulative Percent
Valid
Least favourite
5
25.0
25.0
25.0
Less favourite
6
30.0
30.0
55.0
Neutral
3
15.0
15.0
70.0
Favourite
2
10.0
10.0
80.0
Most favourite
4
20.0
20.0
100.0
Total
20
100.0
100.0


This is the questions which analyse which types of meals are the most favourite meals for respondents. The graph show that, there is 30% of respondents are choosing less favourite for colonel burger. However, 25 % of respondents are thinks that colonel burgers are least favourite for them. 15% of respondents are neutral towards it. 10% of respondents are choosing colonel burgers are their favourite and 20% of respondents are choosing colonel burger are their most favourite meals in KFC.


b)

Zinger

Frequency
Percent
Valid Percent
Cumulative Percent
Valid
Least favourite
2
10.0
10.0
10.0
Less favourite
2
10.0
10.0
20.0
Neutral
7
35.0
35.0
55.0
Favourite
5
25.0
25.0
80.0
Most favourite
4
20.0
20.0
100.0
Total
20
100.0
100.0


Based on the research, there are respectively 10% of respondents are choosing zinger are their least favourite and less favourite meals. 35% of respondents are ticking neutral for the zinger, 25% of respondents are choosing zinger are their favourite meals and 20% of respondents are think that zinger is their most favourite meals.


c)


Snack Plate

Frequency
Percent
Valid Percent
Cumulative Percent
Valid
Least favourite
2
10.0
10.0
10.0
Less favourite
2
10.0
10.0
20.0
Neutral
5
25.0
25.0
45.0
Favourite
5
25.0
25.0
70.0
Most favourite
5
25.0
25.0
95.0
32.00
1
5.0
5.0
100.0
Total
20
100.0
100.0


There are respectively 10% of respondents are choosing least favourite and less favourite meals for snack plate in KFC. 25% of respondents are feel neutral for snack plate. Moreover, there are 25% of respondents are choosing snack plate are their favourite meals and another 25% of respondents are choosing snack plate as their most favourite meals.

d)

Dinner Plate

Frequency
Percent
Valid Percent
Cumulative Percent
Valid
Least favourite
4
20.0
20.0
20.0
Less favourite
4
20.0
20.0
40.0
Neutral
2
10.0
10.0
50.0
Favourite
4
20.0
20.0
70.0
Most favourite
6
30.0
30.0
100.0
Total
20
100.0
100.0


There are respectively 20% of respondents are choosing dinner plate as their least favourite and less favourite meals compare to other meals. 10% of respondents are choosing neutral. 20% of respondents are choosing dinner plate as their favourite meals, furthermore, there are 30% of respondents are choosing dinner plate as their most favourite meals.


e)

Toasted Twister

Frequency
Percent
Valid Percent
Cumulative Percent
Valid
Least favourite
7
35.0
35.0
35.0
Less favourite
5
25.0
25.0
60.0
Neutral
2
10.0
10.0
70.0
Favourite
4
20.0
20.0
90.0
Most favourite
2
10.0
10.0
100.0
Total
20
100.0
100.0


Based on the research, there are 35% of respondents are dislike toasted twister, they choose it as their least favourite meals, 25% of respondents are choosing toasted twister as their less favourite meals. 10% of respondents are feel neutral. However, there are still have other respondents would like toasted twister. There are20% of respondents choose it as their favourite meals and 10% of respondents choose it as their most favourite meals.


3. Food
a)

Is the food was healthy?

Frequency
Percent
Valid Percent
Cumulative Percent
Valid
strongly disagree
7
35.0
35.0
35.0
disagree
9
45.0
45.0
80.0
neutral
2
10.0
10.0
90.0
agree
1
5.0
5.0
95.0
strongly agree
1
5.0
5.0
100.0
Total
20
100.0
100.0


Most of the respondents think that foods are not healthy in KFC. There are 35% of respondents are strongly disagree that food in KFC are healthy. 45% of respondents are disagree with food are healthy. 10% of respondents are choosing neutral. Yet, there are still have respectively 5% of respondents are choosing foods are healthy in KFC.


b)

Does the food had an excellent selection of items

Frequency
Percent
Valid Percent
Cumulative Percent
Valid
strongly disagree
1
5.0
5.0
5.0
disagree
3
15.0
15.0
20.0
neutral
9
45.0
45.0
65.0
agree
5
25.0
25.0
90.0
strongly agree
2
10.0
10.0
100.0
Total
20
100.0
100.0


Now, this is the part for checking the customers are they think KFC had an excellent selection of items. High percentage of respondents who has chosen neutral, there is 45%. Then, 25% if respondents are agree food had an excellent selection of items and 10% of respondents are strongly agree with it. 5% of respondents are strongly disagree with it, 15% of respondents are disagree. 

  
c)

 Does the food was served hot and fresh

Frequency
Percent
Valid Percent
Cumulative Percent
Valid
disagree
1
5.0
5.0
5.0
neutral
11
55.0
55.0
60.0
agree
6
30.0
30.0
90.0
strongly agree
2
10.0
10.0
100.0
Total
20
100.0
100.0


Most of the respondents feel neutral towards the food was served hot and fresh, there are 55%. There are none of the respondents are choosing strongly disagree for food was served hot and fresh.5% of respondents disagree with it.  30% of respondents are agree with the food was served hot and fresh and 10% of respondents are strongly agree with it.


d)

 Does the menu board was easy to read and understand

Frequency
Percent
Valid Percent
Cumulative Percent
Valid
disagree
3
15.0
15.0
15.0
neutral
3
15.0
15.0
30.0
agree
11
55.0
55.0
85.0
strongly agree
3
15.0
15.0
100.0
Total
20
100.0
100.0


None of the respondents think that the menu board is hard to read and understand. Respectively 15% respondents are disagreeing and think it neutrally. 55% of respondents are agree that KFC’s menu board was easy to read and understand and 15% respondents are strongly agree with it.

  
e)

 Are the dishes were tasty and delicious?

Frequency
Percent
Valid Percent
Cumulative Percent
Valid
disagree
2
10.0
10.0
10.0
neutral
4
20.0
20.0
30.0
agree
11
55.0
55.0
85.0
stongly agree
3
15.0
15.0
100.0
Total
20
100.0
100.0


There are 55 of respondents which thinks that foods in KFC are tasty and delicious. There are none of respondents are strongly disagree. 10% of respondents are disagree. 20% are feel towards neutral the dishes were tasty and neutral.15% of respondent are strongly agree.


2. Environment
a)

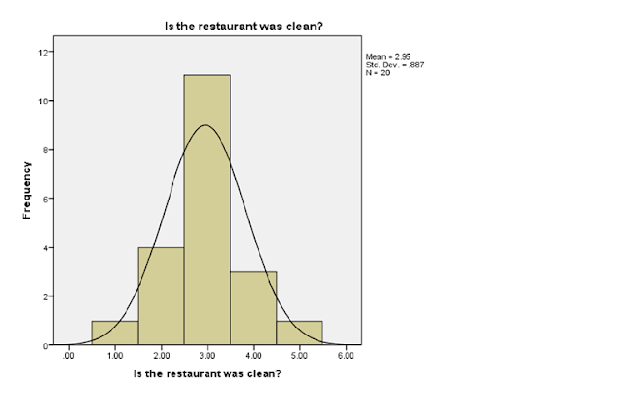
Is the restaurant was clean?

Frequency
Percent
Valid Percent
Cumulative Percent
Valid
strongly disagree
1
5.0
5.0
5.0
disagree
4
20.0
20.0
25.0
neutral
11
55.0
55.0
80.0
agree
3
15.0
15.0
95.0
strongly agree
1
5.0
5.0
100.0
Total
20
100.0
100.0


There are 5% of respondents are strongly disagree with the cleanliness in the restaurant. 20% of respondents are disagreeing. 55% of respondents are feel neutrally for the cleanliness in KFC. 15% agree the restaurant is clean and 5% of respondents are strongly agree.


b)

Is the washroom was clean?

Frequency
Percent
Valid Percent
Cumulative Percent
Valid
disagree
6
30.0
30.0
30.0
neutral
10
50.0
50.0
80.0
agree
3
15.0
15.0
95.0
strongly agree
1
5.0
5.0
100.0
Total
20
100.0
100.0


None of the respondents are strongly disagree with the cleanliness in the washroom. 50% of respondents are feel neutral towards the washroom cleanliness. 30% of respondents are disagreeing that the washroom are not clean. 15% of respondents are agree that the washroom is clean and another 5%of respondents are strongly agree with it.

 
c)

Does the temperature in the restaurant was comfortable?

Frequency
Percent
Valid Percent
Cumulative Percent
Valid
disagree
2
10.0
10.0
10.0
neutral
10
50.0
50.0
60.0
agree
7
35.0
35.0
95.0
strongly agree
1
5.0
5.0
100.0
Total
20
100.0
100.0


None of the respondents are strongly disagree. 10% respondents are disagree that the tempearature was not comfortable. 50% of respondents thinks it is neutral. 35% of respondents are agreeing that temperature is comfortable for them. 5% of respondents are strongly agree.

  
d)

Does the seating arrangement was neat and confortable?

Frequency
Percent
Valid Percent
Cumulative Percent
Valid
disagree
1
5.0
5.0
5.0
neutral
12
60.0
60.0
65.0
agree
4
20.0
20.0
85.0
strongly agree
3
15.0
15.0
100.0
Total
20
100.0
100.0


None of the respondents are strongly disagree with seating arrangements. 5% of respondents are disagreeing. 60% of respondents are ticking neutral. 20% of respondents are agree with the seating arrangement was neat and comfortable and 15% of respondents are strongly agree.


e)

Is the lighting good?

Frequency
Percent
Valid Percent
Cumulative Percent
Valid
disagree
1
5.0
5.0
5.0
neutral
14
70.0
70.0
75.0
agree
3
15.0
15.0
90.0
strongly agree
2
10.0
10.0
100.0
Total
20
100.0
100.0


None of the respondents are strongly disagree. 5% of respondents are disagree. 70% of respondents are feels that the light is fine for them, so it is neutral.15% of respondents are agree with the lighting is good and 10% of respondents are choosing lighting good.


3. Services
a)

Are you seated promptly?

Frequency
Percent
Valid Percent
Cumulative Percent
Valid
disagree
1
5.0
5.0
5.0
neutral
15
75.0
75.0
80.0
agree
4
20.0
20.0
100.0
Total
20
100.0
100.0


None of the respondents think that the seating are not promptly. There are 5% of respondents disagree. 75% of respondents are feels the seat promptly are fine for them.20% of respondents are agree whereas none of the respondents are strongly agreeing.

   
b)

Is the waiting time short?

Frequency
Percent
Valid Percent
Cumulative Percent
Valid
disagree
5
25.0
25.0
25.0
neutral
11
55.0
55.0
80.0
agree
3
15.0
15.0
95.0
strongly agree
1
5.0
5.0
100.0
Total
20
100.0
100.0


None of the respondents strongly disagree. 25% of respondents are disagreeing that the waiting time is short. 55% of respondents are ticking neutral. 15 % respondents are agree and5% of respondents are strongly agree.


c)

Are there availability of utensils and sauces?

Frequency
Percent
Valid Percent
Cumulative Percent
Valid
disagree
2
10.0
10.0
10.0
neutral
8
40.0
40.0
50.0
agree
9
45.0
45.0
95.0
strongly agree
1
5.0
5.0
100.0
Total
20
100.0
100.0


Most of the respondents are agree that the availability of utensils and sauces which is 45%. There is none of the respondents strongly disagreeing for availability of utensils and sauces. 10% of respondents are disagreeing. 40% of respondents are feel neutral. and another 5% of respondents  are strongly agree.

  
d)

Does the meal items served correctly as ordered

Frequency
Percent
Valid Percent
Cumulative Percent
Valid
disagree
2
10.0
10.0
10.0
neutral
9
45.0
45.0
55.0
agree
9
45.0
45.0
100.0
Total
20
100.0
100.0


There are 45% of respondents are feel neutral towards meals items were served correctly as ordered, furthermore, there are 45% of respondents who are agree of the order are served correctly. None of the respondents feel strongly disagree. 10% of respondents are disagree of the meal item.


e)

Does the food items were served correct and complete?

Frequency
Percent
Valid Percent
Cumulative Percent
Valid
disagree
1
5.0
5.0
5.0
neutral
8
40.0
40.0
45.0
agree
9
45.0
45.0
90.0
strongly agree
2
10.0
10.0
100.0
Total
20
100.0
100.0


5% of respondents are disagree. 40% of respondents are feels neutral toward it. There are 45% of respondents are agree, moreover, there are 10% of respondents are strongly agree with the items were served correctly and completely.
  

4. Staffs
a)

Does the staffs were courteous and friendly when taking order?

Frequency
Percent
Valid Percent
Cumulative Percent
Valid
strongly disagree
2
10.0
10.0
10.0
neutral
12
60.0
60.0
70.0
agree
6
30.0
30.0
100.0
Total
20
100.0
100.0


There are 60% of respondents are feel neutral towards the staffs were courteous and friendly when taking order, which is most of the respondents were choosing it. 30% of respondents are agree with the staff are courteous and friendly. However, there are still have 10% of respondents are strongly disagree with it. There are none of the respondents are disagree or strongly agree.

  
b)

Does the staff were aware for taking order with customers?

Frequency
Percent
Valid Percent
Cumulative Percent
Valid
disagree
5
25.0
25.0
25.0
neutral
12
60.0
60.0
85.0
agree
3
15.0
15.0
100.0
Total
20
100.0
100.0


60% of respondents are feels neutral towards the staff were aware for taking order with customers. None of the respondents are strongly agree and strongly disagree. 25% of respondents are disagree.15% of respondents are agree with the staff were aware when taking order with customers.
  

c)

Does the staffs speaks clearly and politely?

Frequency
Percent
Valid Percent
Cumulative Percent
Valid
1.00
1
5.0
5.0
5.0
neutral
15
75.0
75.0
80.0
agree
4
20.0
20.0
100.0
Total
20
100.0
100.0


Most of the respondents are feel neutral towards the staffs speak clearly and politely, it is 75% among 20 respondents. There are 5% of respondents are strongly disagree. 20% of respondents agreeing with the staffs speaks clearly and politely. None of the respondents disagree.

  
d)

Does the staffs were dressed appropriately and neat in appearance?

Frequency
Percent
Valid Percent
Cumulative Percent
Valid
disagree
2
10.0
10.0
10.0
neutral
14
70.0
70.0
80.0
agree
4
20.0
20.0
100.0
Total
20
100.0
100.0


70% of respondents are feels neutral whether the staffs are dressed appropriately and neat in appearance. 20% of respondents are agree. however, there are 10% of respondents are disagree. None of the respondents are strongly disagree or strongly agree with the staffs appropriately and neat dressed.
  
  
e)

Does the staffs were smile when taking order for customers?

Frequency
Percent
Valid Percent
Cumulative Percent
Valid
strongly disagree
1
5.0
5.0
5.0
disagree
1
5.0
5.0
10.0
neutral
14
70.0
70.0
80.0
agree
4
20.0
20.0
100.0
Total
20
100.0
100.0


70% of respondents are neutrally thinking with the smile of staffs. 20% of respondents are agree. There are  5% of respondents are strongly disagree, another 5% of respondents are disagree with the staffs were smile when taking orders. None of the respondents are strongly agree with the staff’s smile when taking order.