PartA
1.
Gender
Male/Female
|
|||||
Frequency
|
Percent
|
Valid
Percent
|
Cumulative
Percent
|
||
Valid
|
Male
|
10
|
50.0
|
50.0
|
50.0
|
Female
|
10
|
50.0
|
50.0
|
100.0
|
|
Total
|
20
|
100.0
|
100.0
|
||

2.
Age group
Age
group
|
|||||
Frequency
|
Percent
|
Valid
Percent
|
Cumulative
Percent
|
||
Valid
|
18-20
|
10
|
50.0
|
50.0
|
50.0
|
21-23
|
8
|
40.0
|
40.0
|
90.0
|
|
27-29
|
2
|
10.0
|
10.0
|
100.0
|
|
Total
|
20
|
100.0
|
100.0
|
||

Part
B
1.
How many
times do you go KFC in a week?
|
|||||
Frequency
|
Percent
|
Valid
Percent
|
Cumulative
Percent
|
||
Valid
|
1
|
13
|
65.0
|
65.0
|
65.0
|
2
|
4
|
20.0
|
20.0
|
85.0
|
|
3
|
1
|
5.0
|
5.0
|
90.0
|
|
4
|
1
|
5.0
|
5.0
|
95.0
|
|
<5
|
1
|
5.0
|
5.0
|
100.0
|
|
Total
|
20
|
100.0
|
100.0
|
||

2. Favourite meal
a)
Colonel
Burger
|
|||||
Frequency
|
Percent
|
Valid
Percent
|
Cumulative
Percent
|
||
Valid
|
Least favourite
|
5
|
25.0
|
25.0
|
25.0
|
Less favourite
|
6
|
30.0
|
30.0
|
55.0
|
|
Neutral
|
3
|
15.0
|
15.0
|
70.0
|
|
Favourite
|
2
|
10.0
|
10.0
|
80.0
|
|
Most favourite
|
4
|
20.0
|
20.0
|
100.0
|
|
Total
|
20
|
100.0
|
100.0
|
||

This
is the questions which analyse which types of meals are the most favourite
meals for respondents. The graph show that, there is 30% of respondents are
choosing less favourite for colonel burger. However, 25 % of respondents are
thinks that colonel burgers are least favourite for them. 15% of respondents
are neutral towards it. 10% of respondents are choosing colonel burgers are
their favourite and 20% of respondents are choosing colonel burger are their
most favourite meals in KFC.
b)
Zinger
|
|||||
Frequency
|
Percent
|
Valid
Percent
|
Cumulative
Percent
|
||
Valid
|
Least favourite
|
2
|
10.0
|
10.0
|
10.0
|
Less favourite
|
2
|
10.0
|
10.0
|
20.0
|
|
Neutral
|
7
|
35.0
|
35.0
|
55.0
|
|
Favourite
|
5
|
25.0
|
25.0
|
80.0
|
|
Most favourite
|
4
|
20.0
|
20.0
|
100.0
|
|
Total
|
20
|
100.0
|
100.0
|
||
 Based
on the research, there are respectively 10% of respondents are choosing zinger
are their least favourite and less favourite meals. 35% of respondents are
ticking neutral for the zinger, 25% of respondents are choosing zinger are
their favourite meals and 20% of respondents are think that zinger is their
most favourite meals.
Based
on the research, there are respectively 10% of respondents are choosing zinger
are their least favourite and less favourite meals. 35% of respondents are
ticking neutral for the zinger, 25% of respondents are choosing zinger are
their favourite meals and 20% of respondents are think that zinger is their
most favourite meals.
c)
Snack
Plate
|
|||||
Frequency
|
Percent
|
Valid
Percent
|
Cumulative
Percent
|
||
Valid
|
Least favourite
|
2
|
10.0
|
10.0
|
10.0
|
Less favourite
|
2
|
10.0
|
10.0
|
20.0
|
|
Neutral
|
5
|
25.0
|
25.0
|
45.0
|
|
Favourite
|
5
|
25.0
|
25.0
|
70.0
|
|
Most favourite
|
5
|
25.0
|
25.0
|
95.0
|
|
32.00
|
1
|
5.0
|
5.0
|
100.0
|
|
Total
|
20
|
100.0
|
100.0
|
||

d)
Dinner
Plate
|
|||||
Frequency
|
Percent
|
Valid
Percent
|
Cumulative
Percent
|
||
Valid
|
Least favourite
|
4
|
20.0
|
20.0
|
20.0
|
Less favourite
|
4
|
20.0
|
20.0
|
40.0
|
|
Neutral
|
2
|
10.0
|
10.0
|
50.0
|
|
Favourite
|
4
|
20.0
|
20.0
|
70.0
|
|
Most favourite
|
6
|
30.0
|
30.0
|
100.0
|
|
Total
|
20
|
100.0
|
100.0
|
||
 There
are respectively 20% of respondents are choosing dinner plate as their least
favourite and less favourite meals compare to other meals. 10% of respondents
are choosing neutral. 20% of respondents are choosing dinner plate as their
favourite meals, furthermore, there are 30% of respondents are choosing dinner
plate as their most favourite meals.
There
are respectively 20% of respondents are choosing dinner plate as their least
favourite and less favourite meals compare to other meals. 10% of respondents
are choosing neutral. 20% of respondents are choosing dinner plate as their
favourite meals, furthermore, there are 30% of respondents are choosing dinner
plate as their most favourite meals.
e)
Toasted
Twister
|
|||||
Frequency
|
Percent
|
Valid
Percent
|
Cumulative
Percent
|
||
Valid
|
Least favourite
|
7
|
35.0
|
35.0
|
35.0
|
Less favourite
|
5
|
25.0
|
25.0
|
60.0
|
|
Neutral
|
2
|
10.0
|
10.0
|
70.0
|
|
Favourite
|
4
|
20.0
|
20.0
|
90.0
|
|
Most favourite
|
2
|
10.0
|
10.0
|
100.0
|
|
Total
|
20
|
100.0
|
100.0
|
||
 Based
on the research, there are 35% of respondents are dislike toasted twister, they
choose it as their least favourite meals, 25% of respondents are choosing
toasted twister as their less favourite meals. 10% of respondents are feel neutral. However, there are still have other respondents would like toasted
twister. There are20% of respondents choose it as their favourite meals and 10%
of respondents choose it as their most favourite meals.
Based
on the research, there are 35% of respondents are dislike toasted twister, they
choose it as their least favourite meals, 25% of respondents are choosing
toasted twister as their less favourite meals. 10% of respondents are feel neutral. However, there are still have other respondents would like toasted
twister. There are20% of respondents choose it as their favourite meals and 10%
of respondents choose it as their most favourite meals.
3.
Food
a)
Is the
food was healthy?
|
|||||
Frequency
|
Percent
|
Valid
Percent
|
Cumulative
Percent
|
||
Valid
|
strongly disagree
|
7
|
35.0
|
35.0
|
35.0
|
disagree
|
9
|
45.0
|
45.0
|
80.0
|
|
neutral
|
2
|
10.0
|
10.0
|
90.0
|
|
agree
|
1
|
5.0
|
5.0
|
95.0
|
|
strongly agree
|
1
|
5.0
|
5.0
|
100.0
|
|
Total
|
20
|
100.0
|
100.0
|
||

b)
Does the
food had an excellent selection of items
|
|||||
Frequency
|
Percent
|
Valid
Percent
|
Cumulative
Percent
|
||
Valid
|
strongly disagree
|
1
|
5.0
|
5.0
|
5.0
|
disagree
|
3
|
15.0
|
15.0
|
20.0
|
|
neutral
|
9
|
45.0
|
45.0
|
65.0
|
|
agree
|
5
|
25.0
|
25.0
|
90.0
|
|
strongly agree
|
2
|
10.0
|
10.0
|
100.0
|
|
Total
|
20
|
100.0
|
100.0
|
||

Now,
this is the part for checking the customers are they think KFC had an excellent
selection of items. High percentage of respondents who has chosen
neutral, there is 45%. Then, 25% if respondents are agree food had an excellent
selection of items and 10% of respondents are strongly agree with it. 5% of respondents are strongly disagree with it, 15% of
respondents are disagree.
c)
Does the food was served hot and fresh
|
|||||
Frequency
|
Percent
|
Valid
Percent
|
Cumulative
Percent
|
||
Valid
|
disagree
|
1
|
5.0
|
5.0
|
5.0
|
neutral
|
11
|
55.0
|
55.0
|
60.0
|
|
agree
|
6
|
30.0
|
30.0
|
90.0
|
|
strongly agree
|
2
|
10.0
|
10.0
|
100.0
|
|
Total
|
20
|
100.0
|
100.0
|
||
 Most of the respondents feel neutral towards the food was served hot and fresh, there are 55%. There
are none of the respondents are choosing strongly disagree for food was served
hot and fresh.5% of respondents disagree with it. 30% of respondents are agree with the food was
served hot and fresh and 10% of respondents are strongly agree with it.
Most of the respondents feel neutral towards the food was served hot and fresh, there are 55%. There
are none of the respondents are choosing strongly disagree for food was served
hot and fresh.5% of respondents disagree with it. 30% of respondents are agree with the food was
served hot and fresh and 10% of respondents are strongly agree with it.
d)
Does the menu board was easy to read and
understand
|
|||||
Frequency
|
Percent
|
Valid
Percent
|
Cumulative
Percent
|
||
Valid
|
disagree
|
3
|
15.0
|
15.0
|
15.0
|
neutral
|
3
|
15.0
|
15.0
|
30.0
|
|
agree
|
11
|
55.0
|
55.0
|
85.0
|
|
strongly agree
|
3
|
15.0
|
15.0
|
100.0
|
|
Total
|
20
|
100.0
|
100.0
|
||
 None
of the respondents think that the menu board is hard to read and understand.
Respectively 15% respondents are disagreeing and think it neutrally. 55% of
respondents are agree that KFC’s menu board was easy to read and understand and
15% respondents are strongly agree with it.
None
of the respondents think that the menu board is hard to read and understand.
Respectively 15% respondents are disagreeing and think it neutrally. 55% of
respondents are agree that KFC’s menu board was easy to read and understand and
15% respondents are strongly agree with it.
e)
Are the dishes were tasty and delicious?
|
|||||
Frequency
|
Percent
|
Valid
Percent
|
Cumulative
Percent
|
||
Valid
|
disagree
|
2
|
10.0
|
10.0
|
10.0
|
neutral
|
4
|
20.0
|
20.0
|
30.0
|
|
agree
|
11
|
55.0
|
55.0
|
85.0
|
|
stongly agree
|
3
|
15.0
|
15.0
|
100.0
|
|
Total
|
20
|
100.0
|
100.0
|
||

2.
Environment
a)
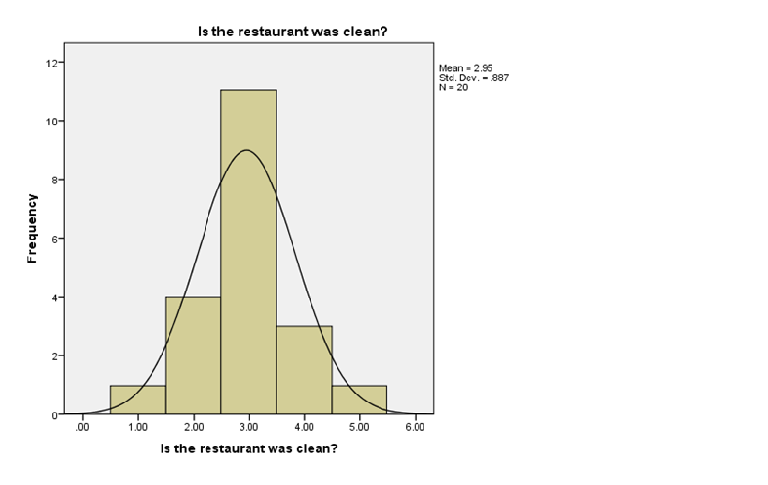
Is the
restaurant was clean?
|
|||||
Frequency
|
Percent
|
Valid
Percent
|
Cumulative
Percent
|
||
Valid
|
strongly disagree
|
1
|
5.0
|
5.0
|
5.0
|
disagree
|
4
|
20.0
|
20.0
|
25.0
|
|
neutral
|
11
|
55.0
|
55.0
|
80.0
|
|
agree
|
3
|
15.0
|
15.0
|
95.0
|
|
strongly agree
|
1
|
5.0
|
5.0
|
100.0
|
|
Total
|
20
|
100.0
|
100.0
|
||
b)
Is the
washroom was clean?
|
|||||
Frequency
|
Percent
|
Valid
Percent
|
Cumulative
Percent
|
||
Valid
|
disagree
|
6
|
30.0
|
30.0
|
30.0
|
neutral
|
10
|
50.0
|
50.0
|
80.0
|
|
agree
|
3
|
15.0
|
15.0
|
95.0
|
|
strongly agree
|
1
|
5.0
|
5.0
|
100.0
|
|
Total
|
20
|
100.0
|
100.0
|
||

c)
Does the
temperature in the restaurant was comfortable?
|
|||||
Frequency
|
Percent
|
Valid
Percent
|
Cumulative
Percent
|
||
Valid
|
disagree
|
2
|
10.0
|
10.0
|
10.0
|
neutral
|
10
|
50.0
|
50.0
|
60.0
|
|
agree
|
7
|
35.0
|
35.0
|
95.0
|
|
strongly agree
|
1
|
5.0
|
5.0
|
100.0
|
|
Total
|
20
|
100.0
|
100.0
|
||

d)
Does the
seating arrangement was neat and confortable?
|
|||||
Frequency
|
Percent
|
Valid
Percent
|
Cumulative
Percent
|
||
Valid
|
disagree
|
1
|
5.0
|
5.0
|
5.0
|
neutral
|
12
|
60.0
|
60.0
|
65.0
|
|
agree
|
4
|
20.0
|
20.0
|
85.0
|
|
strongly agree
|
3
|
15.0
|
15.0
|
100.0
|
|
Total
|
20
|
100.0
|
100.0
|
||
 None of the respondents are strongly disagree with seating arrangements. 5% of
respondents are disagreeing. 60% of respondents are ticking neutral. 20% of
respondents are agree with the seating arrangement was neat and comfortable and
15% of respondents are strongly agree.
None of the respondents are strongly disagree with seating arrangements. 5% of
respondents are disagreeing. 60% of respondents are ticking neutral. 20% of
respondents are agree with the seating arrangement was neat and comfortable and
15% of respondents are strongly agree.
e)
Is the
lighting good?
|
|||||
Frequency
|
Percent
|
Valid
Percent
|
Cumulative
Percent
|
||
Valid
|
disagree
|
1
|
5.0
|
5.0
|
5.0
|
neutral
|
14
|
70.0
|
70.0
|
75.0
|
|
agree
|
3
|
15.0
|
15.0
|
90.0
|
|
strongly agree
|
2
|
10.0
|
10.0
|
100.0
|
|
Total
|
20
|
100.0
|
100.0
|
||

3.
Services
a)
Are you
seated promptly?
|
|||||
Frequency
|
Percent
|
Valid
Percent
|
Cumulative
Percent
|
||
Valid
|
disagree
|
1
|
5.0
|
5.0
|
5.0
|
neutral
|
15
|
75.0
|
75.0
|
80.0
|
|
agree
|
4
|
20.0
|
20.0
|
100.0
|
|
Total
|
20
|
100.0
|
100.0
|
||

b)
Is the
waiting time short?
|
|||||
Frequency
|
Percent
|
Valid
Percent
|
Cumulative
Percent
|
||
Valid
|
disagree
|
5
|
25.0
|
25.0
|
25.0
|
neutral
|
11
|
55.0
|
55.0
|
80.0
|
|
agree
|
3
|
15.0
|
15.0
|
95.0
|
|
strongly agree
|
1
|
5.0
|
5.0
|
100.0
|
|
Total
|
20
|
100.0
|
100.0
|
||
 None
of the respondents strongly disagree. 25% of respondents are disagreeing that
the waiting time is short. 55% of respondents are ticking neutral. 15 %
respondents are agree and5% of respondents are strongly agree.
None
of the respondents strongly disagree. 25% of respondents are disagreeing that
the waiting time is short. 55% of respondents are ticking neutral. 15 %
respondents are agree and5% of respondents are strongly agree.
c)
Are
there availability of utensils and sauces?
|
|||||
Frequency
|
Percent
|
Valid
Percent
|
Cumulative
Percent
|
||
Valid
|
disagree
|
2
|
10.0
|
10.0
|
10.0
|
neutral
|
8
|
40.0
|
40.0
|
50.0
|
|
agree
|
9
|
45.0
|
45.0
|
95.0
|
|
strongly agree
|
1
|
5.0
|
5.0
|
100.0
|
|
Total
|
20
|
100.0
|
100.0
|
||

d)
Does the
meal items served correctly as ordered
|
|||||
Frequency
|
Percent
|
Valid
Percent
|
Cumulative
Percent
|
||
Valid
|
disagree
|
2
|
10.0
|
10.0
|
10.0
|
neutral
|
9
|
45.0
|
45.0
|
55.0
|
|
agree
|
9
|
45.0
|
45.0
|
100.0
|
|
Total
|
20
|
100.0
|
100.0
|
||

e)
Does the
food items were served correct and complete?
|
|||||
Frequency
|
Percent
|
Valid
Percent
|
Cumulative
Percent
|
||
Valid
|
disagree
|
1
|
5.0
|
5.0
|
5.0
|
neutral
|
8
|
40.0
|
40.0
|
45.0
|
|
agree
|
9
|
45.0
|
45.0
|
90.0
|
|
strongly agree
|
2
|
10.0
|
10.0
|
100.0
|
|
Total
|
20
|
100.0
|
100.0
|
||

5%
of respondents are disagree. 40% of respondents are feels neutral toward it.
There are 45% of respondents are agree, moreover, there are 10% of respondents are strongly agree with the items were served correctly and completely.
4.
Staffs
a)
Does the
staffs were courteous and friendly when taking order?
|
|||||
Frequency
|
Percent
|
Valid
Percent
|
Cumulative
Percent
|
||
Valid
|
strongly disagree
|
2
|
10.0
|
10.0
|
10.0
|
neutral
|
12
|
60.0
|
60.0
|
70.0
|
|
agree
|
6
|
30.0
|
30.0
|
100.0
|
|
Total
|
20
|
100.0
|
100.0
|
||
 There are 60% of respondents are feel neutral towards the staffs were courteous and friendly when taking order, which is most of the respondents were choosing it. 30% of respondents are agree with the staff are courteous and friendly. However, there are still have 10% of respondents are strongly disagree with it. There are none of the respondents are disagree or strongly agree.
b)
Does the
staff were aware for taking order with customers?
|
|||||
Frequency
|
Percent
|
Valid
Percent
|
Cumulative
Percent
|
||
Valid
|
disagree
|
5
|
25.0
|
25.0
|
25.0
|
neutral
|
12
|
60.0
|
60.0
|
85.0
|
|
agree
|
3
|
15.0
|
15.0
|
100.0
|
|
Total
|
20
|
100.0
|
100.0
|
||

c)
Does the
staffs speaks clearly and politely?
|
|||||
Frequency
|
Percent
|
Valid
Percent
|
Cumulative
Percent
|
||
Valid
|
1.00
|
1
|
5.0
|
5.0
|
5.0
|
neutral
|
15
|
75.0
|
75.0
|
80.0
|
|
agree
|
4
|
20.0
|
20.0
|
100.0
|
|
Total
|
20
|
100.0
|
100.0
|
||

d)
Does the
staffs were dressed appropriately and neat in appearance?
|
|||||
Frequency
|
Percent
|
Valid
Percent
|
Cumulative
Percent
|
||
Valid
|
disagree
|
2
|
10.0
|
10.0
|
10.0
|
neutral
|
14
|
70.0
|
70.0
|
80.0
|
|
agree
|
4
|
20.0
|
20.0
|
100.0
|
|
Total
|
20
|
100.0
|
100.0
|
||

e)
Does the
staffs were smile when taking order for customers?
|
|||||
Frequency
|
Percent
|
Valid Percent
|
Cumulative
Percent
|
||
Valid
|
strongly disagree
|
1
|
5.0
|
5.0
|
5.0
|
disagree
|
1
|
5.0
|
5.0
|
10.0
|
|
neutral
|
14
|
70.0
|
70.0
|
80.0
|
|
agree
|
4
|
20.0
|
20.0
|
100.0
|
|
Total
|
20
|
100.0
|
100.0
|
||

No comments:
Post a Comment